9series

Intuify

Data & Analytics Business Intelligence & Visualization
120% User Growth
99% Uptime
3000+ Daily Active Users
25% Productivity Gain
Intuify Data Analytics Dashboard

Project Overview

This project developed survey technology that transforms experiences. Intuify integrates multimedia and AI analytics to enhance data quality and improve user experience, capturing unfiltered thoughts for actionable insights.

Intuify - Key Challenges and Goals
Industry Market Research
Size Medium
Market Position Emerging innovator

Specific Business Problems

  • Limited engagement in traditional survey methods, leading to incomplete or inaccurate data.
  • Difficulty in extracting deep, unfiltered insights from respondents.
  • Lack of dynamic, mobile-friendly survey interfaces.

Objectives

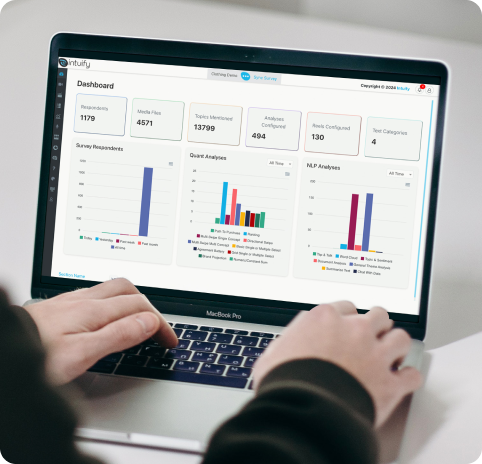
Redefining surveys for better data and insights.

Specific Goals & KPIs

  • 50% higher engagement rates.
  • 40% improved data quality.
  • Higher completion with mobile interfaces.
Intuify - Analytics and Dashboards

AI Functionality

  • AI interprets thoughts and emotions from responses to provide insights into consumer behavior.
  • AI automates complex audience segments using response patterns for analysis.
  • AI predicts trends and behaviors from data, allowing proactive decisions and strategies.

Impact of Challenges

  • Creating intuitive, dynamic survey interfaces to eliminate question fatigue and redundancy.
  • Automating complex segmentation logic for more targeted data analysis.
  • Synchronizing and merging multimedia elements to deliver cohesive respondent experiences.

Proposed Solution

  • Ensured seamless compatibility with existing survey platforms like Qualtrics.
  • Enabled real-time application of segments to analytics dashboards.
  • Implemented seamless subtitle integration for enhanced accessibility.
Responsive Responsive
Vue.js Vue.js
Retail Marketing Retail Marketing
Intuify - Dashboard Solution
Intuify Customizations

Customizations

  • Tailored survey design templates with dynamic question rendering.
  • Real-time analytics dashboards for deep-dive segment analysis.
  • Advanced multimedia editing tools for creating engaging respondent experiences.

Implementation

Process Overview

Phase 1

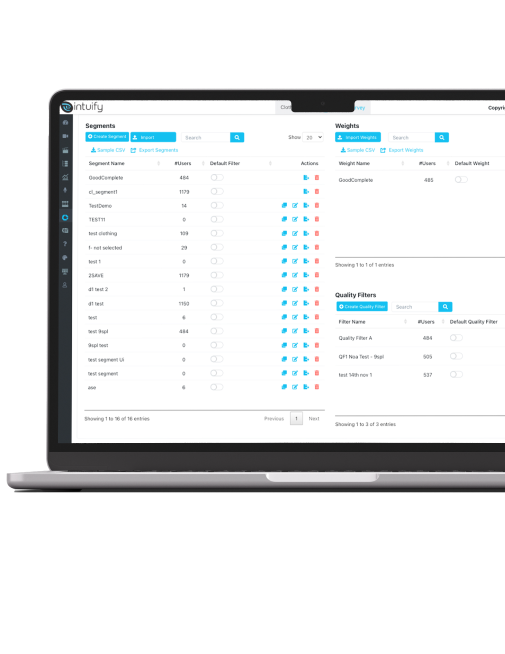
Design and prototyping of the stimulus interface and segment builder.

Phase 2

Development and integration with Qualtrics and other platforms.

Phase 3

Pilot testing and refinement based on respondent feedback.

Phase 4

Full-scale deployment and client onboarding.

Timeline and Milestones

Initial setup and staff training

Pilot testing and adjustments

Final deployment and system go-live

Execution

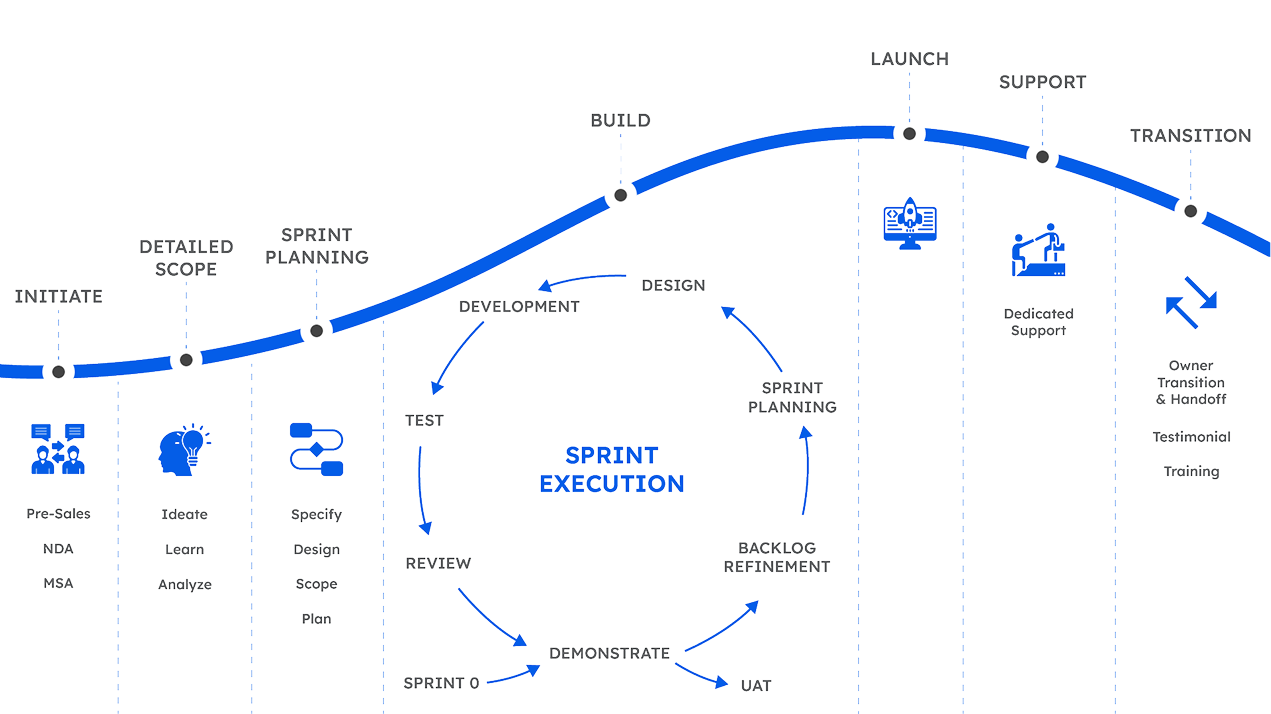
Agile methodology was used for iterative development and feedback.

Weekly sprints, regular stand-up meetings, and progress tracking using project management software.

Agile Development Process

Quantitative Results

60% higher response rates.
45% better data accuracy.
35% faster survey design.

Qualitative Results

  • Enhanced respondent satisfaction due to engaging, mobile-friendly surveys.
  • Deeper insights into consumer behavior, emotions, and decision drivers.
  • Positive feedback from clients on improved data usability and insights.
Intuify Results and Reporting

Ready to Unlock the Value of Your Data?

Strong analytics starts with strong foundations. Whether you're building a modern data platform or preparing for AI, we help you turn data into a strategic advantage.

Trusted by global partners

Nailbiter NUs Safaricom Intuify Solvit i-banq Fractal